Dice Simulation, Probabilities and Matplotlib Animations
Colab Notebook for Dice Rolling Simulations
Hi again! Last time, I worked with JavaScript. Now, it's time to bring out the king when we talk about programming languages for data analysis: Python. This weekend, I prepared this Google Colab notebook (Python Jupyter notebook-like environment in the cloud) mainly with the purpose of training my skills in plotting, and this time, animating with the Matplotlib library.
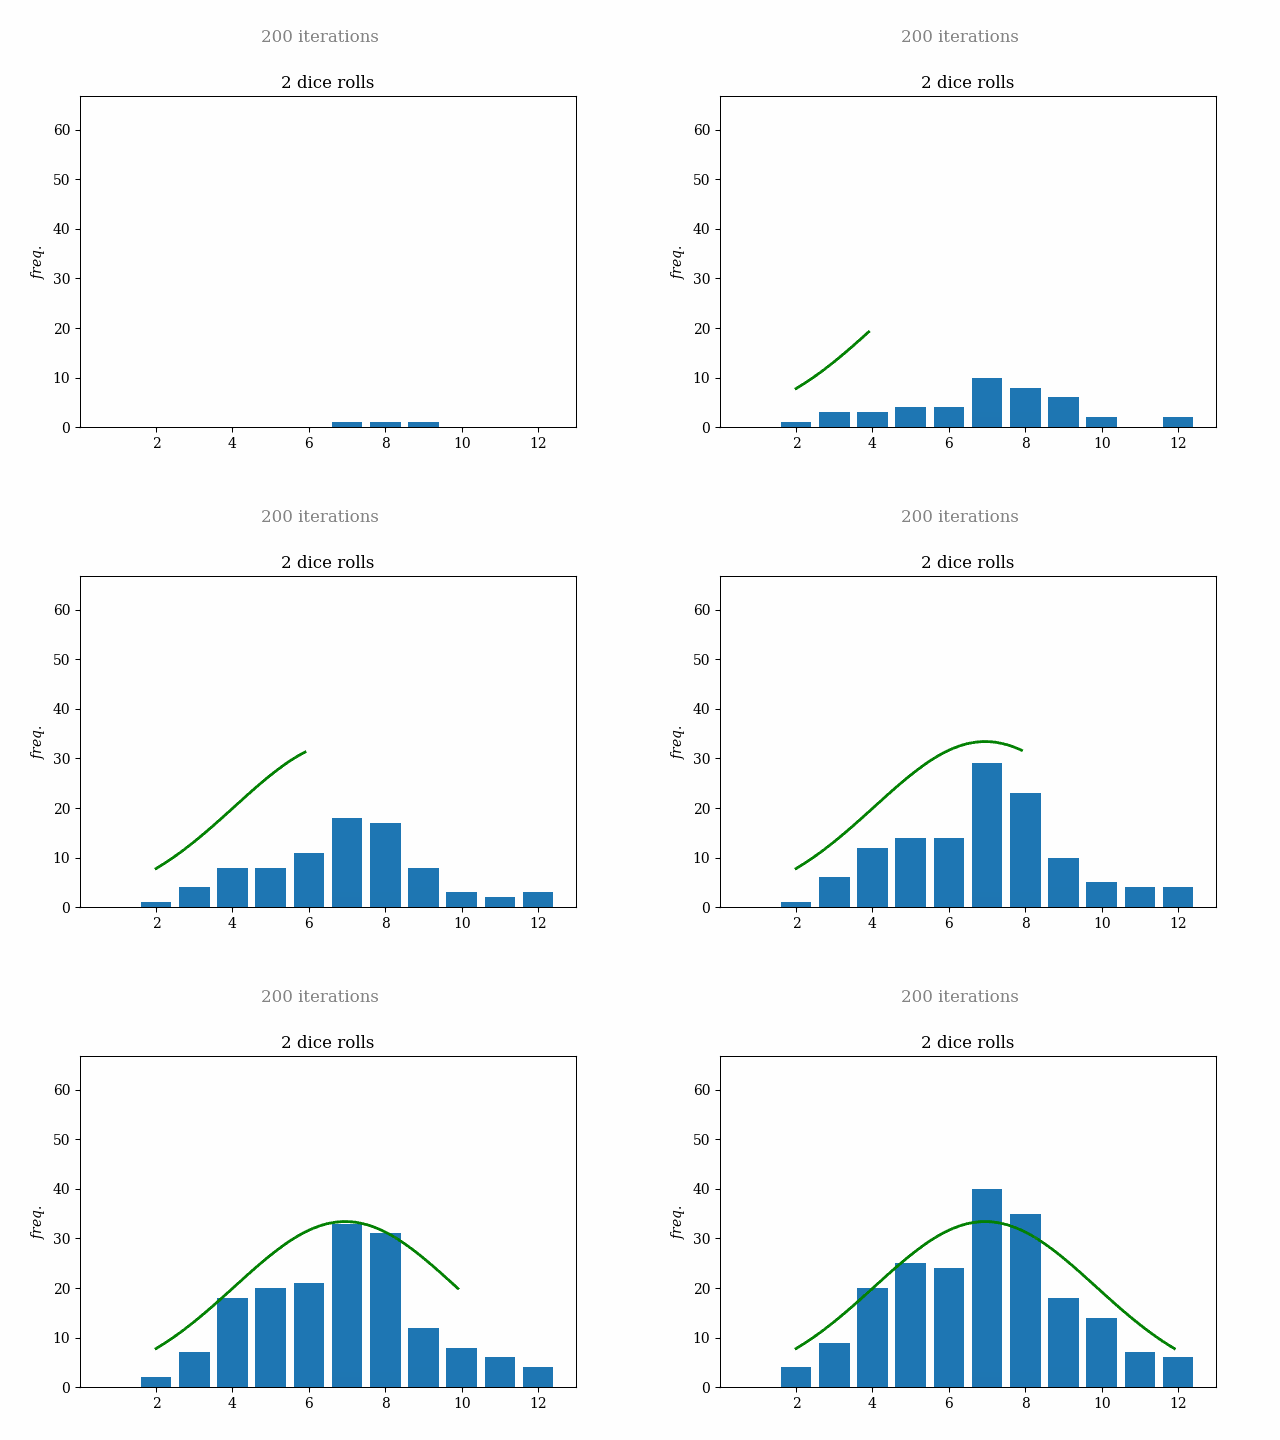
The idea is simple: create plots that, in each iteration, throw the dice randomly and add the sum of the numbers to the frequency bars. At the same time, a normal distribution line is drawn to compare the data with the probability prediction.
Here is the two-dice rolling simulation gif

Obviously, if I wanted to make just this two-dice simulation, it wouldn't be a problem. But my idea was to make a script capable of creating this kind of graph for any number of dice. Also, I achieved that multiple plots were rendered in the same figure to compare results.
To make this, I used a complete OOP system with around 150 lines of code to finally run the program with these simple lines:
# SAMPLE
builder = DiceSumPlotBuilder( [1,2] )
anim = builder.build( frames=50 )
In this case, you have to instantiate the DiceSumPlotBuilder class with a list of the number of dice you want to simulate. Then, the build method returns the Matplotliblib FuncAnimation object to render later.
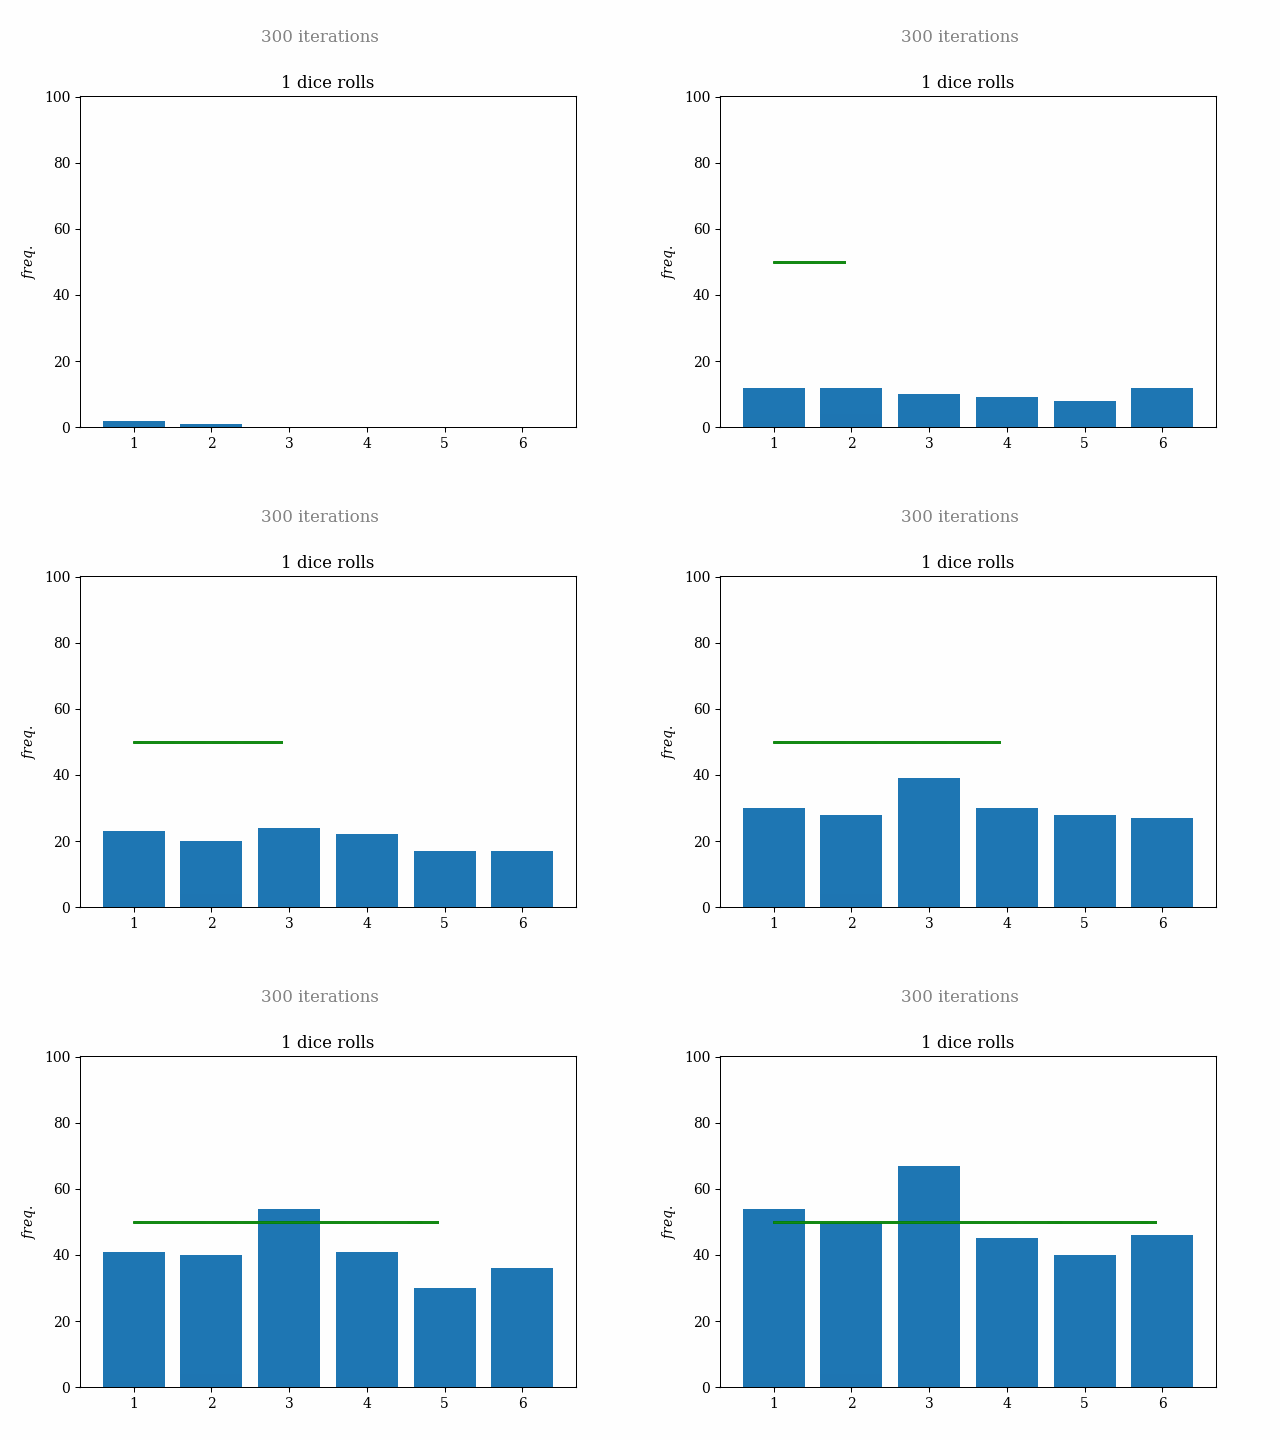
When I believed I finished the project, I wondered what would happen if I tried the one-dice simulation and that didn't work with the normal distribution. I thought to draw a line with the same probability for the 6 cases, and I made it. A funny fact is that I spent around 10 minutes trying to see it, but I put the line with 50% for each one, and that was drawn outside the plot. Then I changed it to 16.66%, and all was fine. Here is the result:

This time I will share with you the complete Google Colab notebook, so you can try and upgrade it. But here, I share with you a block of code that calculates the probability of each possible result with a given number of dice.
def calculate_sum_probs( n_dices ):
  res = {}
  total_cases = 6 ** n_dices

  def genereate_sums( current_dice, acc ):
    if current_dice == 0:
        if not acc in res:
          res[acc] = 0
        res[acc] += 1
    else:
        for i in range(1,7):
          genereate_sums( current_dice - 1, acc + i)

  genereate_sums( n_dices, 0)
  probs = { sum: round(freq / total_cases,3) for sum, freq in res.items() }
  return probs
With this little recursive function, I was able to calculate the results with greater probability and the range of the simulation to fit the normal distribution.
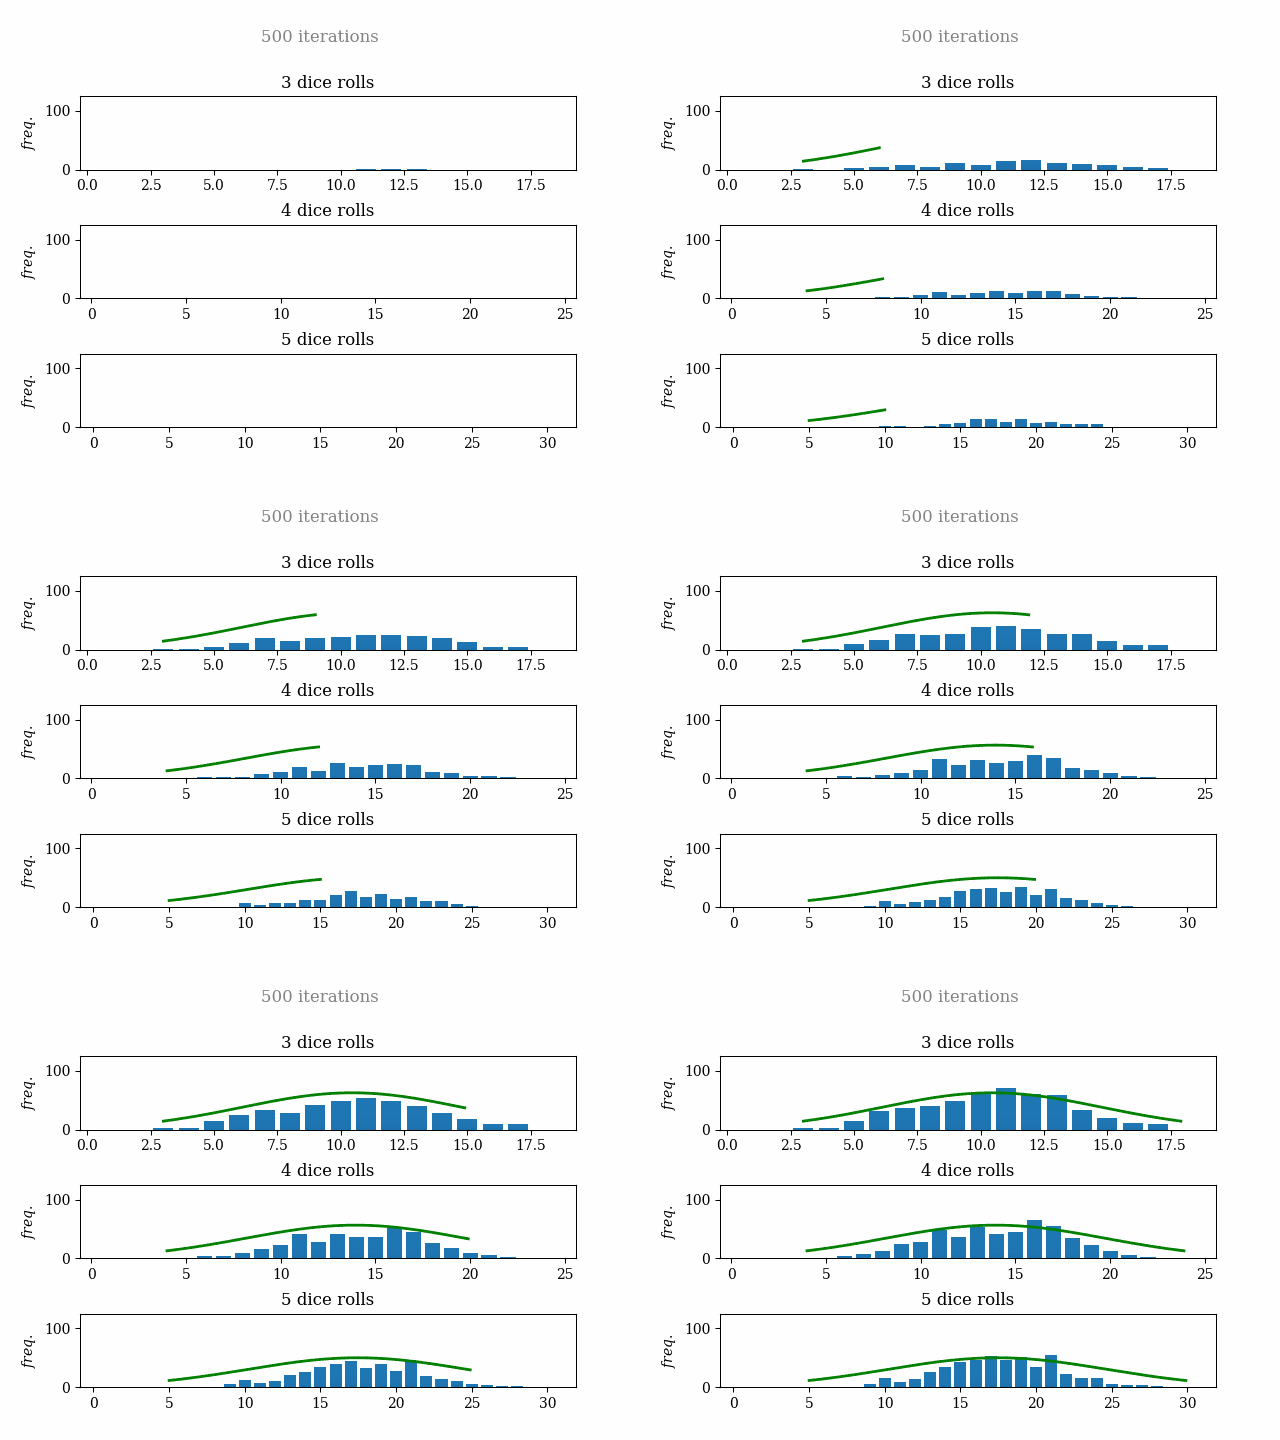
Finally, I share with you the simulation of three, four, and five dice with 500 iterations (two-minute render time :) ) so you can enjoy the math as much as I. See you!

